Traditionally, households were billed for electricity at a flat rate. You could make investments in energy conservation, and the savings would be the quantity of electricity saved multiplied by that flat rate. But in the wholesale market, electricity rates fluctuate a great deal. When demand is highest, the system operators need to bring expensive \”peaking\” power plants on-line, and prices jump. With new \”smart meter\” technology, it is becoming possible for consumers to react to these fluctuations in electricity prices. In \”Dynamic Pricing and Its Discontents\” in the Fall 2011 issue of Regulation magazine, Ahmad Faruqui and Jennifer Palmer offer a nice readable overview of the possibilities. If you\’re teaching a basic economics class and looking for a nice vivid modern real-word example of consumers adjusting to price changes that doesn\’t involve hypothetical pizzas and haircuts, electricity pricing might be a good choice.
Here\’s the underlying issue that causes wholesale electricity prices to fluctuate: \”Since electricity cannot be stored and has to be consumed instantly on demand, and since demand fluctuates based on lifestyle and weather conditions, the electric system typically has to keep spare “peaking” generation capacity online for times when demand may surge on short notice. Often, these “peaking” power plants are only run for 100–200 hours a year, adding to the average cost of providing electricity. Dynamic pricing incentivizes electricity consumers to lower their usage during peak times, especially during the top 100 “critical” hours of the year, which can account for anywhere from 8 to 18 percent of annual peak demand.\”
Smart meters are coming: \”By 2015, according to the Institute of Electric Efficiency, about half of the nation’s 125 million residential customers will have smart meters. The institute anticipates that by 2020, nearly all customers will be on smart meters. Thus, a major technical barrier to dynamic pricing should be lifted in the next five to 10 years.\”
Consumers respond when faced with variable prices: \”However, almost all analyses of pilot results show that customers do respond to dynamic pricing rates by lowering peak usage. Indeed, in 24 different pilots involving a total of 109 different tests of time-varying rates — covering many different locations, time periods, and rate designs — customers have reduced peak load on dynamic rates relative to flat rates, with a median peak reduction (or demand response) of 12 percent…. In other words, the demand for electricity does respond to price, just like the demand for other products and services that consumers buy.\”
Consumers who have better technology to adjust their electricity use react more strongly: \”During the past few years, a variety of new technologies have been introduced to help customers understand their usage patterns (through web portals and in-home displays, for example), to automatically control the function of their major end-uses such as central air conditioning and space heating equipment (smart thermostats), and to manage all their other appliances and plug-loads (home energy management systems). … Looking across all 39 pilot results with enabling technologies, the median peak reduction is 23 percent, 9 percentage points higher than the median across all 109 results.\”
Many low-income customers would benefit from dynamic pricing: \”Some people speculate that because low-income customers typically use less power, they have little discretion in their power usage and are thus unable to shift load depending on price. As a result, low income customers would be hurt by dynamic pricing. However, empirical evaluation of this speculation has indicated that most low-income customers would immediately save money on their electricity bills from dynamic pricing. In general, when customers are placed on a revenue-neutral dynamic rate, we expect roughly half of the customers to immediately see bill increases and half to see bill decreases. Customers who use more load in the peak hours than the average customer would see higher bills, while customers who use less load in the peak hours than the average customer would see lower bills. … Because the low-income customers tend to have flatter load shapes, roughly 65 percent of the low-income customers were immediately better off on the CPP [critical peak pricing] rate than on the flat rate. In other words, even without any change in electricity usage, more than half of low-income customers are better off on a dynamic rate.\” Total savings? \”At the national level, an assessment carried out for FERC twoyears ago showed that the universal application of dynamicpricing in the United States had the potential for quintupling the share of U.S. peak demand that could be lowered through demand response, from 4 percent to 20 percent. Another assessment quantified the value of demand response and showed that even a 5 percent reduction in U.S. peak demand could lower energy costs $3 billion a year.\”
By the middle of 21st century, world population is likely to reach about 9 billion. Set aside for a moment all the other issues involved with this rise in population, and focus on this one: How will the world economy feed them all? A parade of authors led by Jonathan A. Foley offer \”Solutions for a cultivated planet\” in a paper published on-line in Nature on October 12, 2011 (subscription required). Here are some highlights (footnotes and references to figures omitted):
The authors lay out the challenge: \”Recent studies suggest that production would need to roughly double to keep pace with projected demands from population growth, dietary changes (especially meat consumption), and increasing bioenergy use, unless there are dramatic changes in agricultural consumption patterns. Compounding this challenge, agriculture must also address tremendous environmental concerns. Agriculture is now a dominant force behind many environmental threats, including climate change, biodiversity loss and degradation of land and freshwater. … Looking forward, we face one of the greatest challenges of the twenty-first century: meeting society’s growing food needs while simultaneously reducing agriculture’s environmental harm.\”
After offering a detailed and thoughtful analysis of the problem, they make four recommendations:
1) Stop expanding agriculture. They argue that the environmental destruction done by expanding agricultural land in a significant way, especially into tropical forests, is just too great to justify the increases in output that could result.
2) Close yield gaps. \”Here we define a yield gap as the difference between crop yields observed at any given location and the crop’s potential yield at the same location given current agricultural practices and technologies. … Closing yield gaps could substantially increase global food supplies. Our analysis shows that bringing yields to within 95% of their potential for 16 important food and feed crops could add 2.3 billion tonnes (5×10¹⁵kilocalories) of new production, a 58% increase. Even if yields for these 16 crops were brought up to only 75% of their potential, global production would increase by 1.1 billion tonnes (2.8×10¹⁵kilocalories), a 28% increase. Additional gains in productivity, focused on increasing the maximum yield of key crops, are likely to be driven by genetic improvements. Significant opportunities may also exist to improve yield and the resilience of cropping systems by improving ‘orphan crops’ (such crops have not been genetically improved or had much investment) and preserving crop diversity, which have received relatively little investment to date.\”
3) Increase agricultural resource efficiency. \”Even though excess nutrients cause environmental problems in some parts of the world, insufficient nutrients are a major agronomic problem in others. Many yield gaps are mainly due to insufficient nutrient availability. This ‘Goldilocks’ problem of nutrients (that is, there are many regions with too much or too little fertilizer but few that are ‘just right’) is one of the key issues facing agriculture today.\”
4) Increase food delivery by shifting diets and reducing waste. \”Simply put, we can increase food availability (in terms of calories, protein and critical nutrients) by shifting crop production away from livestock feed, bioenergy crops and other non-food applications. … [W]e estimate the potential to increase food supplies by closing the ‘diet gap’: shifting 16 major crops to 100% human food could add over a billion tonnes to global food production (a 28% increase), or the equivalent of 3×10¹⁵ food kilocalories (a 49% increase). … A recent FAO study suggests that about one-third of food is never consumed; others have suggested that as much as half of all food grown is lost; and some perishable commodities have post-harvest losses of up to 100%. Developing countries lose more than 40% of food post-harvest or during processing because of storage and transport conditions. Industrialized countries have lower producer losses, but at the retail or consumer level more than 40% of food may be wasted.\”
Their bottom line: \”Our analysis demonstrates that four core strategies can—in principle—meet future food production needs and environmental challenges if deployed simultaneously. Adding them together, they increase global food availability by 100–180%, meeting projected demands while lowering greenhouse gas emissions, biodiversity losses, water use and water pollution.\”
Here are two other places to turn for useful takes on this topic:
The Economist magazine did one of its consistently excellent \”Special Reports\” on the subject of \”Feeding the World: The Nine Billion People Question\” in the February 24, 2011 issue. The essay is written by John Parker. Here\’s a brief flavor of his argument:
\”An era of cheap food has come to an end. A combination of factors—rising demand in India and China, a dietary shift away from cereals towards meat and vegetables, the increasing use of maize as a fuel, and developments outside agriculture, such as the fall in the dollar—have brought to a close a period starting in the early 1970s in which the real price of staple crops (rice, wheat and maize) fell year after year. This has come as a shock. … The end of the era of cheap food has coincided with growing concern about the prospects of feeding the world. Around the turn of 2011-12 the global population is forecast to rise to 7 billion, stirring Malthusian fears. The price rises have once again plunged into poverty millions of people who spend more than half their income on food. The numbers of those below the poverty level of $1.25 a day, which had been falling consistently in the 1990s, rose sharply in 2007-08. That seems to suggest that the world cannot even feed its current population, let alone the 9 billion expected by 2050. Adding further to the concerns is climate change, of which agriculture is both cause and victim. So how will the world cope in the next four decades?…
feeding the world in 2050 will be hard, and business as usual will not do it. The report looks at ways to boost yields of the main crops, considers the constraints of land and water and the use of fertiliser and pesticide, assesses biofuel policies, explains why technology matters so much and examines the impact of recent price rises. It points out that although the concerns of the critics of modern agriculture may be understandable, the reaction against intensive farming is a luxury of the rich. Traditional and organic farming could feed Europeans and Americans well. It cannot feed the world.\”
In my own Journal of Economic Perspectives, Vernon Ruttan published \”Productivity Growth in World Agriculture: Sources and Constraints,\” in the Fall 2002 issue. Vern had some interesting personal history here. As he told me, one of his earliest papers back in the mid-1950s looked at Malthusian predictions for whether it would be possible to feed the world over the next half-century from that time. He argues persuasively–and as it turned out, correctly–that it would be straightforward to feed the world in the second half of the 20th century with a combination of expanding agricultural land, improved irrigation and fertilizer, and technological progress. However, when Vern sat down around the year 2000 to do the same exercise, he found that it was much harder to be optimistic about feeding the world over the NEXT 50 years. Here\’s how Vern concluded his essay (references omitted):
\”While many of the constraints on agricultural productivity discussed in this paper [like soil, water, pest control and climate] are unlikely to represent a threat to global food security over the next half-century, they will, either individually or collectively, become a threat to growth of agricultural production at the regional and local level in a number of the world’s poorest countries. A primary defense against the uncertainty about resource and environmental constraints is agricultural research capacity. The erosion of capacity of the international research system will have to be reversed; capacity in the presently developed countries will have to be at least maintained; and capacity in the developing countries will have to be substantially strengthened. Smaller countries will need, at the very least, to strengthen their capacity to borrow, adapt and diffuse technology from countries in comparable agroclimatic regions. It also means that more secure bridges must be built between the research systems of what have been termed the “island empires” of the agricultural, environmental and health sciences.
If the world fails to meet its food demands in the next half-century, the failure will be at least as much in the area of institutional innovation as in the area of technical change. This conclusion is not an optimistic one. The design of institutions capable of achieving compatibility between individual, organizational and social objectives remains an art rather than a science. At our present stage of knowledge, institutional design is analogous to driving down a four-lane highway looking out the rear-view mirror. We are better at making course corrections when we start to run off the highway than at using foresight to navigate the transition to sustainable growth in agricultural output and productivity.\”
The TIGTA report sets the stage: \”On March 23, 2010, the Patient Protection and Affordable Care Act (Affordable Care Act) was signed into law. Along with amendments in the Health Care and Education Reconciliation Act of 2010, which was signed on March 30, 2010, this legislation contains revenue provisions anticipated to generate $438 billion in the form of new taxes, fees, and penalties. One of these new taxes is an excise tax on indoor tanning services (referred to hereafter as the tanning tax).\”
Apparently this was a 10% excise tax on tanning services, to be paid by the customer, collected by the business, and the forwarded along to the U.S. government quarterly. \”According to IRS documents, in April 2010 the Indoor Tanning Association estimated that 25,000 businesses were providing indoor tanning services, including approximately 15,000 stand-alone tanning salons and approximately 10,000 other businesses that offer tanning services, such as spas, health clubs, and beauty salons.\” \”The Congressional Joint Committee on Taxation estimated this tax would raise less than $50 million in the last 3 months of Fiscal Year 2010 and raise $200 million for Fiscal Year 2011.\”
But the tax hasn\’t raised nearly that much. Instead of 25,000 businesses filing, only about 10,000 have been filing. Not surprisingly, the tax is likely to raise less than $100 million in 2011, less than half of what was predicted.
I have never entered a tanning booth and hope never to do so. I can readily believe that if overused, they aren\’t great for your skin. But when the federal government starts trying to collect a small amounts of money from many small businesses, it\’s like an elephant standing on a ice rink trying to pick up peanuts. Sure, you get some peanuts. But the contortions and the effort seem hardly worth it. As you consider what the IRS has been going through to collect this tax, and the costs on businesses of record-keeping and dealing with the tax, remember that the $200 million that Congress hoped to raise with this tax represents about 1/20 of 1% of the $438 billion in total revenue-raisers in the health care reform bill. And consider the efforts needed to do this, laid out in dry detail in the TIGTA report:
Of course, the first step is to define which tanning services are covered and which are not: \”This new excise tax applies to indoor tanning services paid for on or after July 1, 2010, and is 10 percent of the amount paid for the tanning services. Indoor tanning services are defined as services using ultraviolet lamps to induce skin tanning. There are other services provided by tanning salons that are excluded from the tanning tax. It does not apply to ‘spray’ tans or topical creams or lotions. In addition, it does not apply to phototherapy services performed by licensed medical professionals, during which individuals are exposed to light for the treatment of certain medical conditions. Tanning services are not taxable when provided by qualified physical fitness facilities (such as a workout facility or gym). The fitness facility must meet various tests to be exempt.\”
This line of business had not owed federal excises before. \”[A]n IRS document describing compliance challenges states, “The tax is new and unusual for this industry, which has never experienced the imposition of a Federal excise tax on tanning services, and thus the overwhelming majority have never filed an excise tax return.\”
Thus, of course the IRS needed an an outreach program to let tanning booth owners know about the bill. This involved \”Hosting live webinars and uploading videos on the YouTube web site,\” \”Outreach to industry associations,\” \”Contacting State licensing bureau,\” \”Issuing electronic bulletins to tax professionals,\” and \”Giving seminars at the Nationwide Tax Forums.\” For the IRS page with its Frequently Asked Questions about the tax, see here.
The new tax required reprogramming IRS computer systems. \”There was a relatively short time period to prepare for receipt and processing of returns reporting the tanning tax. Accordingly, the IRS had to immediately update the computer systems used for processing tax returns. The IRS receives both paper and electronically transmitted returns. … In general, the systems had to be updated to include a new abstract code for the tanning tax, which is a unique number assigned to each of the excise taxes.\”
And of course, now that only about half of those expected to pay are doing so, the IRS is needing to send thousands of follow-up letters, and then to follow up on those letters.
At the end of the day, the tanning tax probably collects more in revenue than the costs to the government and business of putting the tax into place and collecting it. But surely, the IRS resources could be better allocated (more audits on potentially large targets?). Indeed, given how little revenue the tanning tax corrects, it\’s probably misguided to think of it primarily as \”tax\” policy. It\’s some anonymous Congressman or staffer who doesn\’t like tanning booths sticking a tiny provision that almost no one hears about into an enormous bill. It\’s the sort of piddly annoying oddball regulation that gives the rest of government regulation a bad name.
Daron Acemoglu is amazingly wide-ranging, productive, and thought-provoking. A nice sample of his work and thinking emerges from a recently published interview with Douglas Clement of the Minneapolis Federal Reserve.
On the Dodd-Frank financial reform legislation
\”I think the problem with the Dodd-Frank Act is that the amount of good it contains seems to be dwarfed by the amount of additional minute details it contains. That fails to achieve the intent of the regulation. It also gives better regulation a bad name, because people who are opposed to regulation can easily point to the page after page after page of paperwork and procedural things that Dodd-Frank wants you to do. And I am not convinced that the Dodd-Frank Act is going to prevent the next financial collapse if the financial system actually continues on its current trajectory. I don’t think anybody can claim that they know what’s going to happen in the next five years in the financial sector, but the financial sector has become more concentrated. It’s very profitable, it is still investing in highly risky assets and, in fact, it hasn’t really cleaned up its balance sheet to a great degree. The bonus culture, for example, was one of the elements that contributed to the crisis—not by any means the only one, or the most major one, but it was certainly an important factor. It has remained the same. And the Dodd-Frank Act doesn’t really do anything to deal with that. …
I think something that’s much more effective—and again, I view it as a speed- bump-type of regulation—is to increase capital requirements. … If you increase capital requirements, you’re essentially putting in speed bumps because the rate at which a bank can expand its balance sheet is going to be limited by the capital it has to a much greater extent than currently required. Those are the kinds of things that, as long as they’re not very detail-oriented, I think hold more promise. When they are detail-oriented, they are easier to overcome and thwart, and they are also much more costly to the daily functioning of banks.\”
On directed technical change and reducing carbon emissions
\”Essentially, the bulk of the literature in environmental economics has been about how we have to tax economic activity to slow it down so that we don’t damage the environment. If you think of a single-sector economy, with one sector that depends on coal, or on gas, that’s the only thing you can do: slow down that one sector. If you want to reduce carbon emissions, you just have to slow down that sector. Now, you don’t directly slow it down; you change its composition of factors, perhaps, but you can’t let that sector take off at a very rapid rate and still, at the same time, limit carbon emissions.
Our perspective was, well, the economy has several technologies; some of them are cleaner than others. How should we shift toward the cleaner ones? When you look at the climate science, there’s a lot of emphasis precisely on this and on questions such as, When is it that nuclear power will become economical? When will geothermal or wind or solar solve both their cost and their delivery problems?
Therefore, the perspective shouldn’t be, How can we slow down economic activity? Instead, it should be, How can we shift the composition of economic activity away from dirty technologies to cleaner technologies? Now, that’s a very directed-technical-change-related question, but it already comes with a very important implication: The focus shouldn’t be on slowing down economic activity, but on changing its composition and changing the type of technological changes that the market generates.
Moreover, and importantly, we expect there to be a distinctive cumulative aspect to research. Different technologies often build on past successes in the same line of technology. So when you’re building a new car, you build on the past advances in car technology; you don’t as much build on advances in solar technology. In the same way as when you build new solar panels, you’re building on the previous solar panels, not on the diesel engine. What that means is that there’s going to be strong self-reinforcement in changing the direction of technological change. So when technological change shifts away from the dirty technologies that are so fossil-fuel-dependent to the cleaner technologies, it will also make it potentially cheaper to produce these innovations, these cleaner technologies, in the future.\”
On the relationship from political structures to economic growth
\”But later in college and graduate school, I started working on issues related to human capital, economic growth and so on. But then after a while, I sort of realized, well, you know, the real problems of economic growth aren’t just that some countries are technologically innovative and some aren’t, and some countries have high savings rates and some don’t. They are really related to the fact that societies have chosen radically different ways of organizing themselves.
So there is much meaningful heterogeneity related to economic outcomes in the political structures of societies. And these tend to have different institutions regulating economic life and creating different incentives. And I started believing—and that’s reflected in my work—that you wouldn’t make enough progress on the problems of economic growth unless you started tackling these institutional foundations of growth at the same time.\”
Some applications to \”Arab Spring\”
\”The big question is, Is this going to be a political revolution in the same way as the Glorious Revolution in England, which unleashed a fundamental process of transformation in the political system with associated economic changes? Ultimately, such political revolutions are fundamental to the growth of nations. That’s one of the arguments we make.
Or is it going to be the sort of revolution like the Bolshevik Revolution or the independence movements in much of sub-Saharan Africa in the 1960s, where there was a change in political power, but it went from one group to another, which then re-created the same system and started the same sort of exploitative process as the previous one?…
So, there is no guarantee that such movements will translate into a broad-based political revolution, as opposed to sort of a palace coup where one group takes control for another.\”
The U.S. economy has a major problem with unemployment, and in particular with unemployment of low-skilled workers. Apprenticeships are one major way that other countries, like Germany, have addressed this issue. Diane Auer Jones, a former former assistant secretary for postsecondary education at the Department of Education and now at something called the Career Education Corporation in Washington, DC, writes about this in the Summer 2011 issue of Issues in Science and Technology, in an article called \”Apprenticeships Back to the Future.\”
One useful takeaway from the article is the contrast between how apprenticeship programs are a central element of education for the vast majority of students in places like Germany and Switzerland, while they are comparatively so minor in the U.S. labor market.
What apprenticeship programs are like in Germany and Switzerland
\”In Germany and Switzerland, for example, apprenticeships are a critical part of the secondary education system, and most students complete an apprenticeship even if they plan to pursue postsecondary education in the future. It is not uncommon for German or Swiss postsecondary institutions to require students to complete an apprenticeship before enrolling in a tertiary education program. In this way, apprenticeships are an important part of the education continuum, including for engineers, nurses, teachers, finance workers, and myriad other professionals.\”
\”An apprenticeship is a formal, on-the-job training program through which a novice learns a marketable craft, trade, or vocation under the guidance of a master practitioner. Most apprenticeships include some degree of theoretical classroom instruction in addition to hands-on practical experience. Classroom instruction can take place at the work site, on a college campus, or through online instruction in partnership with public- or private-sector colleges. Some apprenticeships are offered as one-year programs, though most span three to six years and require apprentices to spend at least 2,000 hours on the job. Apprentices are paid a wage for the time they spend learning in the workplace. Some apprenticeship sponsors also pay for time spent in class, whereas others do not. Some sponsors cover the costs associated with the classroom-based portion, whereas others require apprentices to pay tuition out of their wages. All of these details are part of the apprenticeship contract …\”
\”In Switzerland, almost 70% of students between the ages of 16 and 19 participate in dual-enrollment vocational education and training (VET) programs, which require students to go to school for one to two days per week and spend the rest of their time in paid on-the-job training programs that last three to four years. … Apprentices are subjected to regular assessments in the classroom and on the job, culminating in final exams associated with certification. In 2008, the completion rate for Swiss apprentices was 79%, and the exam pass rate among program completers was 91%. One of the main benefits of the Swiss apprenticeship system is that nearly 70% of all students participate in it, which means that students of all socioeconomic and ability levels are engaged in this form of learning. Such widespread involvement prevents the social stigmatization of apprenticeship programs, unlike in the United States where social prestige is almost exclusively preserved for college-based education and training. Moreover, because students entering dual-track VET programs are frequently high performers, they are academically indistinguishable from the students who elect university education rather than vocational training or dual education. As a result, Swiss dual-track VET students are likely to enter the workplace well prepared for work by possessing strong academic skills.\”
The status of apprenticeship programs in the United States
\”In the United States, however, apprenticeships generally have been considered to be labor programs for training students to work in the skilled trades or crafts. They are not viewed as education programs, so they have not become a conventional part of most secondary or postsecondary systems or programs. …\”
\”Apprenticeship programs do exist in the United States, but they are vastly underused, poorly coordinated, nonstandardized, and undervalued by students, parents, educators, and policymakers. The first successful federal legislative effort to promote and coordinate apprenticeships was the National Apprenticeship Act of 1937, commonly known as the Fitzgerald Act. This act treated apprentices not as students but as laborers, and it authorized the Department of Labor (DOL) to establish minimum standards to protect the health, safety, and general welfare of apprentice workers. The DOL still retains oversight responsibility through its Office of Apprenticeships, but the office receives an anemic annual appropriation of around $28 million.\”
\”In each state, the DOL supports a state apprenticeship agency that certifies apprenticeship sponsors, issues certificates of completion to apprentices, monitors the safety and welfare of apprentices, and ensures that women and minorities are not victims of discriminatory practices. In 2007, the latest year for which data are available, there were approximately 28,000 Registered Apprenticeship programs involving approximately 465,000 apprentices. Most of the programs were in a handful of fields and industries, including construction and building trades, building maintenance, automobile mechanics, steamfitting, machinist, tool and dye, and child care.\”
Comment
In America, many schools and parents and students will speak out strongly in favor of strong commitments to \”community service\” and volunteer projects and unpaid short-term internships. But many of these same people tend to recoil if the discussion turns to devoting similar amounts of time to a paid apprenticeship. As an American, it\’s hard to imagine a Swiss-style system where 70% of students, spread across the distribution of incomes and education levels, are in apprenticeship programs. It\’s hard to think about apprenticeships that would spread across a much wider range of jobs and industries than we currently see in the U.S. Such a change would require a substantial adjustment from firms, existing employees, schools, government, and students themselves. But the current hand-off from the education system to the job market isn\’t going too well for a lot of Americans at a wide array of skill levels. Maybe apprenticeships could help.
The most recent World Development Report from the World Bank is centered on the theme: \”Gender Equality and Development.\” The first chapter of the report focuses on gains that have been made, and I posted earlier today on surprising (to me) conclusion that around the world, gender equality has been largely attained in education and health. However, the second chapter focuses on dimensions of inequality that persist. The chapter focuses certain contexts where a high degree of gender inequality persists: for example, in lack of female participation in certain occupations and in political leadership, and in certain areas or economic groups where females are disadvantaged in many dimensions of life. But to me, the most appalling example of gender inequality is expressed by the problem of the \”missing women.\” Based on evidence from biology and experience in high-income countries, we know that on average, slightly more men are born than women, and that women tend to have longer life-expectancies than men. But when we then apply those known proportions to certain countries and regions, we find that girls are missing at birth, and women are dying too frequently. Some excerpts, with footnotes and most references to tables and figures omitted, as usual:
Skewed sex ratios at birth and 3.9 million women missing under the age of 60 \”First, the problem of skewed sex-ratios at birth in China and India (and in some countries in the Caucasus and the Western Balkans) remains unresolved (table 2.1). Population estimates suggest that an additional 1.4 million girls would have been born (mostly in China and India) if sex ratios at birth in these countries resembled those found worldwide. Second, compared with developed economies, the rate at which women die relative to men in low- and middle-income countries is higher in many regions of the world. Overall, missing girls at birth and excess female mortality under age 60 totaled an estimated 3.9 million women in 2008—85 percent of them were in China, India, and Sub-Saharan Africa.\”
A first main cause: Preference for Sons \”The disadvantage against unborn girls is widespread in many parts of Asia and in some countries in the Caucasus (such as Armenia and Azerbaijan), where the intersection of a preference for sons, declining fertility, and new technology increases the missing girls at birth. In China and India, sex ratios at birth point to a heavily skewed pattern in favor of boys. Where parents continue to favor sons over daughters, a gender bias in sex-selective abortions, female infanticide, and neglect is believed to account for millions of missing girls at birth. In 2008 alone, an estimated 1 million girls in China and 250,000 girls in India were missing at birth. The abuse of new technologies for sex-selective abortions—such as cheap mobile ultrasound clinics—accounted for much of this shortfall, despite laws against such practices in many nations, such as India and China. Economic prosperity will continue to increase amniocentesis and ultrasound services throughout the developing world, possibly enabling the diffusion of sex-selective abortions where son-preferences exist. … This does not imply that change is impossible: The Republic of Korea’s male-female sex ratio under age five was once the highest in Asia, but it peaked in the mid-1990s and then reversed—a link to societal shifts in normative values stemming from industrialization and urbanization.\” A second main cause: Maternal Mortality \”The female disadvantage in mortality during the reproductive ages is in part driven by the risk of death in pregnancy and childbirth and associated long-term disabilities. Although maternal mortality ratios have fallen by 34 percent since 1990, they remain high in many parts of the world: Sub-Saharan Africa had the highest ratio in 2008 at 640 maternal deaths per 100,000 live births, followed by South Asia (280), Oceania (230), and Southeast Asia (160). Bangladesh, Cambodia, India, and Indonesia have maternal mortality ratios comparable to Sweden’s around 1900, and Afghanistan’s is similar to Sweden’s in the 17th century. … Driving the high maternal mortality rates in many countries are poor obstetric health services and high fertility rates. Income growth and changes in household behavior alone appear insufficient to reduce maternal mortality; public investments are key to improving maternal health care services.\”
The most recent World Development Report from the World Bank is centered on the theme: \”Gender Equality and Development.\” The first chapter of the report focuses on gains that have been made; the second chapter focuses on dimensions of inequality that persist. In this post, I\’ll focus on two patterns from the first chapter that I had not known about–on average, women the world around seem to have near-parity, and in some cases better than parity, with men in education and in health care. In a later post, I\’ll focus on what seems to me the most appalling widespread gender inequality that remains in the world today.
Global gender parity in education
\”In the past decade, female enrollments have grown faster than male enrollments in the Middle East and North Africa, South Asia, and Sub-Saharan Africa. Gender parity has been reached in 117 of 173 countries with data (figure 1.1). Even in regions with the largest gender gaps—South Asia and Sub-Saharan Africa (particularly West Africa)—gains have been considerable. In 2008, in Sub-Saharan Africa, there were about 91 girls for every 100 boys in primary school, up from 85 girls in 1999; in South Asia, the ratio was 95 girls for every 100 boys.
\”The patterns are similar in secondary education, with one notable difference. In roughly one-third of developing countries (45), girls outnumbered boys in secondary education in 2008 (see figure 1.1). Although the female gender gap tends to be higher in poorer countries, boys were in the minority in a wide range of nations including Bangladesh, Brazil, Honduras, Lesotho, Malaysia, Mongolia, and South Africa.
Tertiary enrollment growth is stronger for women than for men across the world. The number of male tertiary students globally more than quadrupled, from 17.7 million to 77.8 million between 1970 and 2008, but the number of female tertiary students rose more than sevenfold, from 10.8 million to 80.9 million, overtaking men. Female tertiary enrollment rates in 2008 lagged behind in only 36 developing countries of 96 with data (see figure 1.1). …
\”Although boys are more likely than girls to be enrolled in primary school, girls make better progress—lower repetition and lower dropout rates—than boys in all developing regions. … Gender now explains very little of the remaining inequality in school enrollment … In a large number of countries, a decomposition of school enrollments suggests that wealth is the constraining factor for most, and in only a very limited number will a narrow focus on gender (rather than poverty) reduce inequalities further …\”
Gender parity in health
\”In most world regions, life expectancy for both men and women has consistently risen, with women on average living longer than men. The gap between male and female life expectancy, while still rising in some regions, stabilized in others. On average, life expectancy at birth for females in low-income countries rose from 48 years in 1960 to 69 years in 2008, and for males, from 46 years to 65. Mirroring the worldwide increase in life expectancy, every region except Sub-Saharan Africa added between 20 and 25 years of life between 1960 and today. …. And since 1980, every region has had a female advantage in life expectancy.
In most developing countries, fertility rates fell sharply in a fairly short period. These declines were much faster than earlier declines in today’s rich countries. In the United States, fertility rates fell gradually in the 1800s through 1940, increased during the baby boom, and then leveled off at just above replacement. In India, fertility was high and stable through 1960 and then sharply declined from 6 births per woman to 2.3 by 2009. What took the United States more than 100 years took India 40 (figure 1.4). Similarly, in Morocco, the fertility rate fell from 4 children per woman to 2.5 between 1992 and 2004.\”
\”On various other aspects of health status and health care, differences by sex are small. In many low-income countries, the proportion of children stunted, wasted, or underweight remains high, but girls are no worse off than boys. In fact, data from the Demographic and Health Surveys show that boys are at a slight disadvantage. … Similarly, there is little evidence of systematic gender discrimination in the use of health services or in health spending. Out-of-pocket spending on health in the 1990s was higher for women than for men in Brazil, the Dominican Republic, Paraguay, and Peru. Evidence from South Africa reveals the same pro-female pattern, as does that for lower income countries. … Evidence from India, Indonesia, and Kenya tells a similar story. … For preventive health services such as vaccination, poverty rather than gender appears to be the major constraining factor …\”
W. Brian Arthur has written \”The Second Economy\” for the October 2011 issue of the McKinsey Quarterly. (Free registration is needed to access the article.) The subheading under the title is: \”Digitization is creating a second economy that’s vast, automatic, and invisible—thereby bringing the biggest change since the Industrial Revolution.\” As one expects from Arthur, this short essay is full of thought-provoking comments. Here are a few highlights:
What does an economic transformation look like?
\”In 1850, a decade before the Civil War, the United States’ economy was small—it wasn’t much bigger than Italy’s. Forty years later, it was the largest economy in the world. What happened in-between was the railroads. They linked the east of the country to the west, and the interior to both. They gave access to the east’s industrial goods; they made possible economies of scale; they stimulated steel and manufacturing—and the economy was never the same.
Deep changes like this are not unusual. Every so often—every 60 years or so—a body of technology comes along and over several decades, quietly, almost unnoticeably, transforms the economy: it brings new social classes to the fore and creates a different world for business. Can such a transformation—deep and slow and silent—be happening today? …
But I want to argue that something deep is going on with information technology, something that goes well beyond the use of computers, social media, and commerce on the Internet. Business processes that once took place among human beings are now being executed electronically. They are taking place in an unseen domain that is strictly digital. On the surface, this shift doesn’t seem particularly consequential—it’s almost something we take for granted. But I believe it is causing a revolution no less important and dramatic than that of the railroads. It is quietly creating a second economy, a digital one.\” …
\”Now this second, digital economy isn’t producing anything tangible. It’s not making my bed in a hotel, or bringing me orange juice in the morning. But it is running an awful lot of the economy. It’s helping architects design buildings, it’s tracking sales and inventory, getting goods from here to there, executing trades and banking operations, controlling manufacturing equipment, making design calculations, billing clients, navigating aircraft, helping diagnose patients, and guiding laparoscopic surgeries. Such operations grow slowly and take time to form. …\”
First an economic system with muscles, and now one with nerves
\”Think of it this way. With the coming of the Industrial Revolution—roughly from the 1760s, when Watt’s steam engine appeared, through around 1850 and beyond—the economy developed a muscular system in the form of machine power. Now it is developing a neural system. This may sound grandiose, but actually I think the metaphor is valid. Around 1990, computers started seriously to talk to each other, and all these connections started to happen. The individual machines—servers—are like neurons, and the axons and synapses are the communication pathways and linkages that enable them to be in conversation with each other and to take appropriate action.
Is this the biggest change since the Industrial Revolution? Well, without sticking my neck out too much, I believe so. In fact, I think it may well be the biggest change ever in the economy. It is a deep qualitative change that is bringing intelligent, automatic response to the economy. There’s no upper limit to this, no place where it has to end. Now, I’m not interested in science fiction, or predicting the singularity, or talking about cyborgs. None of that interests me. What I am saying is that it would be easy to underestimate the degree to which this is going to make a difference.
I think that for the rest of this century, barring wars and pestilence, a lot of the story will be the building out of this second economy, an unseen underground economy that basically is giving us intelligent reactions to what we do above the ground. For example, if I’m driving in Los Angeles in 15 years’ time, likely it’ll be a driverless car in a flow of traffic where my car’s in a conversation with the cars around it that are in conversation with general traffic and with my car. The second economy is creating for us—slowly, quietly, and steadily—a different world. …\”
Will this second economy change the nature of jobs and how economic production is distributed?
\”The second economy will produce wealth no matter what we do; distributing that wealth has become the main problem. For centuries, wealth has traditionally been apportioned in the West through jobs, and jobs have always been forthcoming. When farm jobs disappeared, we still had manufacturing jobs, and when these disappeared we migrated to service jobs. With this digital transformation, this last repository of jobs is shrinking—fewer of us in the future may have white-collar business process jobs—and we face a problem.
The system will adjust of course, though I can’t yet say exactly how. Perhaps some new part of the economy will come forward and generate a whole new set of jobs. Perhaps we will have short workweeks and long vacations so there will be more jobs to go around. Perhaps we will have to subsidize job creation. Perhaps the very idea of a job and of being productive will change over the next two or three decades. The problem is by no means insoluble. The good news is that if we do solve it we may at last have the freedom to invest our energies in creative acts.\”
The U.S. International Trade Commission has published the 7th edition of its occasional report: \”The Economic Effects of Significant U.S. Import Restraints.\” The report comes in two main parts. The first part, discussed in an earlier post here, is an overview and status report on the main U.S. barriers. The second part concerns the trend toward longer global supply chains. Here are some highlights (with footnotes and citations expunged for readability throughout):
Description and illustration of a basic global supply chain
\”For example, a domestic firm might provide the R&D and design of a product, and produce the initial intermediate inputs using local raw materials, as in figure 3.1. Then these intermediate inputs would be exported to a second country, where a firm would use them to produce a semifinished product. That firm would then export the semifinished good to a third country, where the final good is assembled and packaged. The third country would then export the good back to the domestic firm, which would oversee the marketing, retailing, and delivery of the product domestically and abroad. Supply chains like these require extensive organizational oversight. They also typically involve heavy reliance on telecommunications to ensure that different stages of the product are made to specification and on logistics to coordinate the movement of material across many firms and countries. As the case studies later in this chapter illustrate, global supply chains can involve complex interconnections between different tasks, as well as between domestic and foreign firms carrying out those tasks. This complexity is managed by lead firms in the chain that oversee production and make other key decisions …
What factors are driving longer global supply chains? A key force behind the widespread development of global supply chains has been technological change. Over time, technological change has allowed more production processes to be fragmented—split into stages or tasks—and those stages or tasks to be carried out in new, often distant locations. For example, in the 1970s some apparel production for the U.S. market was offshored in nearby countries in the Caribbean region. But advances in telecommunications and in transport have allowed the industry to source from distant Asian suppliers and still meet the time-sensitive demands of the industry. … Two other important drivers in the development of global chains are the extensive global trade liberalization (e.g., reduction in tariff and nontariff barriers) and falling transportation costs that have occurred in the past quarter-century. Because goods and services produced by global supply chains typically cross borders multiple times, they pass through multiple customs regimes and are affected by multiple tariffs and nontariff barriers. Thus, the benefits of trade liberalization can also be multiplied for goods and services produced in global supply chains.\”
Expansion of the processing trade
\”Numerous countries have set up programs to encourage processing trade, which allow duty-free imports of components used in products made solely for export. Using data on these programs provides a more direct measure of global supply chain trade, since all of the trade in the components and products affected by the programs moves through a supply chain. China and Mexico are the two largest users of export processing regimes in the developing world, and together account for about 80–85 percent of such exports worldwide. Chinese trade grew by more than 800 percent between 1995 and 2008—and about half of this growth is attributable to Chinese processing trade. Mexico is also heavily reliant on processing trade; processing imports represented over 50 percent of total Mexican imports in 2006.\”
A Cautionary Story for the U.S. in Global Supply Chains: Flat-Panel Display Televisions
There are two key components for FPD [flat-panel display] televisions, the display panel and the chipset, which together account for 94 percent of the costs. The global supply chain for FPD televisions uses glass produced in Japan and Korea; displays incorporating the glass, assembled in Japan, Korea, and Taiwan; and semiconductor chip sets designed in the United States and elsewhere and produced in China, Korea, Singapore, and Taiwan. Assembly occurs principally in China, the world’s largest television producer, although most sets destined for the U.S. market are assembled in Mexico. … U.S. participation in the global supply chain is now limited to the design of chips, some product development, distribution, marketing, and customer service. The last U.S. television factory (owned by Sony) closed in 2009. All televisions sold in the United States now are imported from original equipment manufacturers (OEMs) with factories outside the United States (principally in Mexico) or from contract manufacturers with factories principally in Mexico and China. The sole remaining U.S.-headquartered television brand, Vizio, entered the U.S. market in 2002. Vizio has no factories of its own, but rather uses contract manufacturers in China, Taiwan, and Mexico to produce goods to Vizio’s specifications. Although Vizio builds products that incorporate current technology, it does no R&D; instead, it purchases patents or licenses the technology from other patent owners. Vizio has also acquired other patents, which it licenses to other television manufacturers. The principal suppliers of finished televisions to Vizio are two contract manufacturers in Taiwan, Foxconn and Amtran. These companies are also part owners of Vizio.\”
A U.S. Success in Global Supply Chains: Logistics
U.S. firms are among the leading logistics providers worldwide and hence have become essential participants in global supply chains. Logistics, the coordinated movement of goods and services, encompasses diverse activities that oversee the end-to-end transport of raw, intermediate, and final goods between suppliers, producers, and consumers…. The largest and most diversified U.S. logistics firms are FedEx and UPS, although for both firms, primary revenues are derived from the express delivery of letters and small packages. Some other large U.S.-based logistics firms include C.H. Robinson Worldwide, Expeditors International of Washington, Caterpillar Logistics Services, and Penske Logistics. All of these firms operate globally and typically have hundreds of offices worldwide. Like FedEx and UPS, these firms have added logistics and supply chain capabilities to their main lines of business which, for example, include the transportation of heavy freight (Caterpillar) and the arrangement of transportation services (C.H. Robinson and Expeditors). For all firms, supply chain management is a fast-growing business segment, with U.S. revenues for supply chain services having grown by about 20 percent during 2004–09.
Shifting to a value-added view of trade
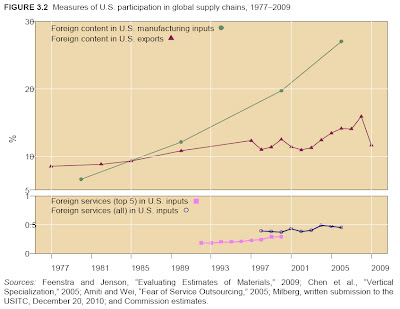
When products cross national borders several times, then instead of focusing on the value of what crosses the border, which is \”gross trade,\” it becomes important to understand \”value-added\” trade–that is,what value-added occurred within your country. One approach here is to look at the foreign content in your production. The green line shows that foreign content in U.S. manufacturing has risen from about 10% in the mid-1980s to more than 25% now. Overall foreign content in U.S. exports has risen, but more slowly, from about 8% in the late 1970s to as high as 15% before the recession hit full force in 2008.
Looking at value-added also affects how one sees bilateral trade patterns. Here\’s an explanation: \”China is the final assembler in a large number of global supply chains, and it uses components from many other countries to produce its exports. The figure below shows that the U.S.-China trade deficit on a value-added basis is considerably smaller (by about 40 percent in 2004) than on the commonly reported basis of official gross trade.b By contrast, Japan exports parts and components to countries throughout Asia; many of these components are eventually assembled into final products and exported to the United States. Thus the U.S.-Japan trade balance on a value-added basis is larger than the comparable gross trade deficit. The U.S. value-added tradedeficits with other major trading partners (Canada, Mexico, and the EU-15) differ by smaller amountsfrom their corresponding gross trade deficits.\”
Other ways in which longer global supply chains change thinking about international trade Here are some other changes: \”Modern complex supply chains generate more trade than traditional supply networks in which only raw materials or final goods might be sent across international borders. In the earlier example of a supply chain in which the stages in figure 3.1 were carried out in three countries, the product was exported three times before being sold in final form at home or abroad. Global chains can also generate new patterns of specialization, as firms in a particular country often specialize in a particular stage or task. In electronics, for example, intermediate and semifinished goods are often produced in Japan, Hong Kong, South Korea, and Taiwan, while final assembly activities are often contracted to Chinese firms. Finally, global chains can change the nature of a nation’s trade. As countries become more vertically specialized, their imports and exports are increasingly composed of intermediate goods and services that are moving to the next stage in the chain.\”
I would add two final thoughts here:
1) It will be interesting to see if the growth of global supply chains alters the political economy of trade. In the old view of trade, firms within a certain country made goods like cars or machine tools or computers. That doesn\’t happen so much any more; instead, firms within a country do pieces and parts of the production process. As manufacturers of cars and computers and other goods become less national in scope, will there be less political pressure to protect them from international trade? Or will being more economically intertwined make trade seem like a more frightening and salient issue?
2) The U.S. economy has some large advantages in a world of longer global supply chains: the sheer size of its existing markets; its functional rules of law and finance; its expertise in logistics and marketing; its well-developed communication and transportation facilities; the cultural and personal connections that American has throughout the world economy; its R&D and scientific capabilities; and the flexibility of its workers and firms. There are a lot of clouds in the future economic outlook for the U.S., but one potential bright spot–if we go out and seize it–is the multiplicity of roles that the U.S. can play in the longer supply chains of an evolving global economy.
For more on this subject, and in particular some measures of how foreign content in exports has evolved over recent decades, see my post from August 19 is about an IMF report on Longer Global Supply Chains.
The U.S. International Trade Commission has published the 7th edition of its occasional report: \”The Economic Effects of Significant U.S. Import Restraints.\” The report comes in two main parts. The first part is an overview and status report on the main U.S. barriers. The second part, which I\’ll discuss in a follow-up post, concerns the trend toward longer global supply chains.
The main message of the first part the report is that the U.S. economy is in general extremely open to imports: \”The United States is one of the world’s most open economies. In 2010, the average U.S. tariff on all goods remained near its historic low of 1.3 percent, on an import-weighted basis, essentially unchanged from the previous update in 2009. Nonetheless, significant restraints on trade remain in certain sectors. The U.S. International Trade Commission (Commission) estimates that U.S. economic welfare, as defined by total public and private consumption, would increase by about $2.6 billion annually by 2015 if the United States unilaterally ended (“liberalized”) all significant restraints quantified in this report. Exports would expand by $9.0 billion and imports by $11.5 billion. These changes would result from removing import barriers in the following sectors: sugar, ethanol, canned tuna, dairy products, tobacco, textiles and apparel, and other high-tariff manufacturing sectors.\”
The single most costly trade barrier concerns rules against importing ethanol. The fact that such rules exist at all, of course, strongly suggests that the key issue in ethanol policy is not how much gasoline we can replace, but instead how much of a subsidy can find a justification for sending to farmers. Here\’s the ITC overview:
\”Because of rapidly increasing quantities of ethanol mandated by the U.S. Renewable Fuel Standard, both U.S. ethanol production and U.S. imports of ethanol are projected to rise markedly by 2015. The projected higher import quantities and the continued moderate restrictiveness of ethanol restraints combine to make these restraints the most costly (in welfare terms) among all sectors considered. The Commission estimates that liberalizing ethanol import restraints would increase welfare by $1.5 billion and increase imports by 45 percent in 2015. Although liberalization would reduce the domestic industry’s output and employment from their projected 2015 levels by 4–5 percent, these changes are minor considering that the ethanol industry employment and output are both projected to more than double between 2005 and 2015, with or without liberalization.\”
One final element of these reports that I always appreciate is that they treat employment issues in the context of the overall economy where over time wages and industries adjust. Thus, while for each trade barrier the report seeks to quantify output and employment changes that would arise if that trade barrier was lifted, the report is also careful to note that as the economy adjusts, an equivalent number of job would arise elsewhere. This message comes through far too seldom in discussions of international trade: barriers to trade, or lifting barriers to trade, aren\’t going to alter the total number of jobs over time, but instead will shift the industries and sectors where those jobs occur.