A “population pyramid” is a graph that shows the number of people of each age group divided into male and female. Because the oldest age groups at the top of the figure have small populations, the graph will narrow toward a point at the top. But looking across population pyramids for different years, you can see the movements of larger and smaller generations as they age. Here’s are population pyramids for 2000, 2010, and 2020 from the US Census Bureau (“Age Profiles of Smaller Geographies Don’t Always Mirror the National Trend,” by Laura Blakeslee, Megan Rabe, Zoe Caplan and Andrew Roberts, May 25, 2023).
The authors write:
The pyramid was larger in 2020 than it was in either 2010 or 2000. This reflects the growth in the U.S. population: 331.4 million people in 2020, up 22.7 million (7.4%) from the 308.7 million in 2010. Between 2000 and 2010, the population grew by 27.3 million (9.7%) from 281.4 million people. The U.S. population also aged since 2000. The baby boom cohort moved up the pyramid, from 36-to-54-year-olds in 2000 to 46-to-64-year-olds in 2010 and 56-to-74-year-olds in 2020. The millennials were mostly in their teens and 20s in 2010 but young adults (in their 20s and 30s) a decade later. At the same time, the base of the pyramid representing children under age 5 got smaller in 2020, reflecting a recent decrease in the number of births in the United States.
Population pyramid diagrams have been around a long time. The authors also include one from a Bureau of the Census report in 1900. Again, each bar represents five years of age. You can see that the number of people in the 85-90 age group almost disappears in this diagram, and the bars for those 90 and over do disappear. You can also see that this is a true “pyramid,” in the sense the younger the age group, the bigger it is. Of course, this is the sign of a growing population.
There are four main reasons for the difference in spending growth between mental health care and general medical care.
First, the main driver of cost growth in the general health care sector has been technological change, particularly through the introduction of capital-intensive devices and procedures (Chernew and Newhouse 2011). In contrast, the technology of treatment in mental health continues to rely on labor and prescription drugs. Newer treatments for mental health conditions have typically offered few gains in efficacy, although they have generated improvements in treatment adherence and outcomes by reducing side effects and increasing the tolerability of treatments (Insel 2022). While psychopharmacology experienced considerable innovation prior to 2000, relatively few new classes of drugs for treating mental illnesses have been introduced since then. …
Second, over the past 50 years there has been dramatic, cost-reducing substitution for the human and institutional inputs that were previously used to provide mental health care. In 1975, 63 percent of mental health care spending was for institutional care in hospitals and nursing homes; today, 31 percent of expenditures occur in these costly settings (SAMHSA 2014; 2016). Treatment with prescription drugs has taken a central position in treatment of mental illnesses, often substituting for costlier psychotherapy for the most prevalent mental health conditions, depression and anxiety. … The cost of psychotherapy itself has also dropped sharply because the mental health sector has been far more accommodating of diverse types of health care providers than has general health care. Psychotherapy provision has shifted from treatment by psychiatrists and PhD-level psychologists to treatment by social workers, counselors, and MA-level psychologists. … Today over 90 percent of psychotherapists are trained below the doctoral level, a far higher share than in the 1970s and 1980s. The shift towards lower cost professionals with less extensive training has driven the costs of psychotherapy down, without any documented evidence of a reduction in quality—although no recent studies have directly compared the quality of services delivered by those with varied professional training …
Third, a much larger share of mental health care (just under two-thirds) is paid for by public funds (about one-third is paid by Medicaid) than is the case for general health care, and a much larger share—20 percent—is paid for by programs under fixed budgets. Public programs generally pay lower prices. …
Finally, mental health spending appears to be growing much more slowly than general health spending, in part because of a change in classification. In the 1970s and 1980s, when institutional treatment of those with serious mental illness accounted for a much larger share of mental health spending than it does today, all the expenses of institutional treatment—including the costs of whatever limited clinical treatment was provided as well as the costs of institutional room and board, often of poor quality—were counted as part of mental health spending. Today, the costs of housing and food for people with serious mental illness, who are not typically institutionalized, are no longer counted as part of mental health treatment spending.
The authors also point out that support and services for mentally ill people end up being provided in a range of non-health-care contexts. They draw up on a wide array of evidence across studies and programs to compile the following table.
As the authors point out, it seems plausible that the US is investing too little in care for those who have serious mental illnesses, but too much for those with milder concerns. They write:
Current policy choices have led to a misallocation of resources in the delivery of clinical services. Too few people with treatable mental health conditions, including those with serious illness, obtain care that could help them. This situation may arise, in part, because the decisions of people suffering from mental illness to seek care may not accurately reflect the likely value of such care to themselves and to others, as well as because of underinvestment in treatment capacity for the most serious conditions. At the same time, moral hazard associated with insurance coverage of mental health services may lead to overuse (or inappropriate use) of some services within this category, either to address problems of living that cause relatively little impairment or because the quality and nature of treatments are so variable. Both overuse and underuse reflect the fundamental difficulty of matching people and treatments in the face of great heterogeneity and uncertain diagnosis.
Fifty years ago, Axel Leijonhufvud wrote “Life among the Econ,” an essay of satirical truth-telling in a style that is so often attempted and so seldom successful (Western Economic Journal, September 1973, 11:3, 327-337, available many places online with a quick search). The opening paragraph gives the flavor of what follows:
The Econ tribe occupies a vast territory in the far North. Their land appears bleak and dismal to the outsider, and travelling through it makes for rough sledding; but the Econ, through a long period of adaptation, have learned to wrest a living of sorts from it. They are not without some genuine and sometimes even fierce attachment to their ancestral grounds, and their young are brought up to feel contempt for the softer living in the warmer lands of their neighbours, such as the Polscis and the Sociogs. Despite a common genetical heritage, relations with these tribes are strained–the distrust and contempt that the average Econ feels for these neighbours being heartily reciprocated by the latter–and social intercourse with them is inhibited by numerous taboos. The extreme clannishness, not to say xenophobia, of the Econ makes life among them difficult and perhaps even somewhat dangerous for the outsider. This probably accounts for the fact that the Econ have so far not been systematically studied. Information about their social structure and ways of life is fragmentary and not well validated. More research on this interesting tribe is badly needed.
The article is extraordinarily quotable, perhaps especially in its comments about “modls.”
The dominant feature, which makes status relations among the Econ of unique interest to the serious student, is the way that status is tied to the manufacture of certain types of implements, called “modls.” The status of the adult male is determined by his skill at making the “modl” of his “field.” The facts (a) that the Econ are highly status-motivated, (b) that status is only to be achieved by making “modls,” and (c) that most of these “modls” seem to be of little or no practical use, probably accounts for the backwardness and abject cultural poverty of the tribe. …
Contrary to the normal case in primitive societies, the Econ priesthood does not maintain and teach the history of the tribe. In some Econ villages, one can still find the occasional elder who takes care of the modls made by some long-gone hero of the tribe and is eager to tell the legends associated with each. But few of the adults or grads, noting what they regard as the crude workmanship of these dusty old relics, care to listen to such rambling fairytales. Among the younger generations, it is now rare to find an individual with any conception of the history of the Econ. Having lost their past, the Econ are without confidence in the present and without purpose and direction for the future.
Some Econographers disagree with the bleak picture of cultural disintegration just given, pointing to the present as the greatest age of Econ Art. It is true that virtually all Econographers agree that present modi making has reached aesthetic heights not heretofore attained. But it is doubtful that this gives cause for much optimism. It is not unusual to find some particular art form flowering in the midst of the decay of a culture. It may be that such decay of society induces this kind of cultural “displacement activity” among talented members who despair of coping with the decline of their civilization. The present burst of sophisticated modi-carving among the Econ should probably be regarded in this light.
As an inveterate reader of mystery fiction myself, Leijonhufvud’s essay reminds me of a comment from Father Brown, the detective-figure in G.K. Chesterton’s well-known series. In the 1927 story, “The Secret of Father Brown,” Father Brown says:
Science is grand thing when you can get it; it its real sense one of the grandest words in the world. But what do these men mean, nine times out of ten, when they use it nowadays? … They mean getting `outside’ a man and studying him as if here were a gigantic insect; in what they would call a dry impartial light; in what I should call a dead and dehumanised light. They mean getting a long way off him, as if he were a distant prehistoric monster … When the scientist talks about a type, he never means himself, but always his neighbour; probably his poorer neighbour. I don’t deny that the dry light may sometimes do some good; though in one sense it’s the very reverse of science. So far from being knowledge, it’s actually suppression of what we know. It’s treating a friend as a stranger, and pretending that something familiar is really remote and mysterious.
Perhaps all the social sciences are subject to a similar critique, but for economics, it seems to me to have a particular bite.
1) The world economy is at or near a record high in exports, foreign direct investment and migration. Travel was way down in 2021, but we’ll see in the next few year if the pandemic made a permanent or temporary change.
2) The upper-right panel of the above figure shows that exports as a share of GDP have levelled off in recent years–while remaining near the all-time high. However, global flows of data and information are dramatically rising. The first figure show the annual growth of international internet traffic. After a jump to 47% growth during the pandemic year of 2020, it seems to have gone back to the typical pre-pandemic growth rate of about 25% per year. The second figure shows the steady rise in the share of global phone calls (including calls over the internet) that are international. These patterns suggest that international flows of services (not counting tourism, of course!), rather than goods, have been rising substantially.
3) In general, the distance of international flows is up over the past 20 years and the share of trade happening within regions is down–although these patterns have leveled out in the last decade or so.
4) China and the United States are clearly experiencing conflicts that have reduced their international economic ties. But the economic relationship remains quite substantial.
On the effects of geopolitical tensions, there is clear evidence of the U.S. and China reducing their focus on flows with each other. Considering a sample of 11 types of trade, capital, information, and people flows, the share of U.S. flows taking place to or from China fell from 9.3% in 2016 to 7.3% in 2022 (or the most recent year with data available). Meanwhile, the share of China’s flows that were to or from the U.S. fell from 17.8% to 14.3%. Those are noteworthy declines relative to 2016 levels, but small changes relative to the U.S. and China’s total flows with the world. And even after these declines, the U.S. and China are still connected by far larger flows than any other pair of countries that do not share a border. Decoupling between the U.S. and China has not—at least yet—led to a wider fracturing of the world economy into rival blocs. There is very limited evidence of close allies of the U.S. and China reducing their focus on flows with the rival bloc.
Indeed, it may be that the US-China conflicts end rearranging the patterns of world trade, with reduced flows between the two countries, but with those international flows being redirected to other countries rather than reduced.
4) There is considerable room for globalization to expand. The authors write:
[T]he world is less globalized than many presume. Most activity that could take place either within or across national borders is still domestic, not international. Roughly 20% of global economic output is exported (in value-added terms), FDI flows equal just 6% of gross fixed capital formation, about 7% of phone call minutes (including calls over the internet) are international, and only 4% of people live outside of the countries where they were born.4 Surveys consistently show that most people overestimate these types of measures, and that such misperceptions exacerbate fears about globalization.
I would add that it’s always easier for politics to blame malignant foreigners for any issues faced by the domestic economy, rather than focusing on what might be done to make US workers and US markets more productive, innovative, and flexible.
The point out that policy choices have been leaning against globalization for a few years now, including the import tariffs enacted during the Trump administration and continued during the Biden administration, and also the global trade sanctions imposed on Russia after its invasion of Ukraine. The hot new word in international trade is “friend-shoring,” which refers to trading only (or mostly) with friendly nations. Countries around the world are placing greater faith in government subsidies to industry as a way of encouraging growth.
One point in particular in their essay, suggesting the difficulties of deglobalizing in the modern economy, struck me forcibly: the theory of “massive modularity.” Goldberg and Reed describe it this way:
[A] recent paper by Thun et al (2022) introduces a new concept, “massive modularity,” that characterizes many production processes today, and argue that the presence of massive modularity makes it extremely hard to “decouple,” “reshore,” and generally reorganize economic activity across borders. Massive modular systems involve several modules that are interconnected with each other, can experience innovation independent of each other, and can be broken into smaller, more specialized modules, each of which can again experience independent innovation. Different firms, located in different countries, specialize in different modules making production structures extremely complex. As an example, they cite the CEO of Pfizer, who once stated that the company’s Covid-19 vaccine “requires 280 different materials and components that are sourced from 19 countries around the world.” The vast complexity of modern production poses a challenge for policy as measures aimed at reducing risk or promoting domestic industries may have unintended consequences. In general, rebuilding massively modular industries in all their complexity on a national level is a Herculean task. Even if it doesn’t fail, it will certainly take many years to accomplish. Given that the sectors characterized by this high complexity are precisely those sectors that are key to innovation and growth, this effort will likely slow down growth in the US and global economy.
It often seems to me that US-based discussions of globalization are built on a presumption that the US gets to play the leading role in deciding how and whether globalization will happen. This assumption was a pretty good one for the second half of the 20th century. But as other economies around the world–notably China and India–have grown dramatically, their need to drive their own development by exporting into the US market has been reduced. Instead, such countries have a greater ability to depend on selling into their own growing domestic markets–or selling to markets in the rest of the world. The US can decide that it wants to be less exposed to the gains and costs and disruptions of global markets, but many other countries around the world will not choose to follow that US decision.
“Industrial policy” can be distinguished from a “business-friendly policy” by the amount of targeting involved. Industrial policy chooses the industries that will be favored with some some combination of subsidies, tax breaks, and trade protectionism–sometimes even the companies that will be favored. Common examples in a recent US context include attempt to favor cars, steel, semiconductors, electric vehicles, and solar panels. On the other side, a business-friendly environment seeks to create a set of education, infrastructure, tax, R&D, regulatory, and other possibilities that give many different kinds of businesses a chance to compete, innovate, and thrive, but steers away from picking either industries or firms.
The world economy seems to be entering an era of industrial policy, and Finance & Development (published by the IMF) has offered a couple of readable essays on the subject recently. Ruchir Agawal wrote “Industrial Policy and the Growth Strategy Trilemma” (published online March 21, 2023). Douglas Irwin has now followed up with “The Return of Industrial Policy” (forthcoming in June 2023 issue)
It’s perhaps useful to state what should be a obvious fact about industrial policy: It can’t be a simple way for governments to create economic prosperity. Otherwise, every country could just choose the industries in which it wants to succeed, and then use industrial policy to achieve prosperity. Thus, it’s no surprise that it’s easy to compile a list of industrial policies that went sideways.
For example, back in 1991 Linda Cohen and Roger Noll published a book called The Technology Pork Barrel, which was based on case studies of US attempts to build infant industries in supersonic planes, communications satellites, a space shuttle, breeder reactors, photovoltaics, and synthetic fuels. I remember back in the 1980s when Japan announced with great fanfare the “Fifth Generation” computer project, which then went away with out fanfare. I remember when Japan was the shining example of how industrial policy worked in the 1970s and into the 1980s, but somehow it abruptly stopped being a shining example when Japan’s economy entered three decades of stagnation starting in the Brazil decided that it would become a computer-producing power in the 1970s and 1980s, and when Argentina decide that it would become a global electronics superpower. I remember the economic disaster that was the industrial policy of the Soviet Union. I remember the places around the world that have tried to be the next “Silicon XXXX,” generally without success.
Was the US economy in the 19th century an industrial policy success story? Irwin argues “no”:
The belief that richer countries were successful because they protected manufacturing gave respectability to industrial policy. That turned out to be a misreading of history. Despite high tariffs, the United States developed as an open economy—open to immigration, capital, and technology—and one with an exceptionally large domestic market that was fiercely competitive. Furthermore, the high-tariff United States overtook free-trade Britain in per capita income in the late 19th century by increasing labor productivity in the service sector, not by raising productivity in the manufacturing sector (Broadberry 1998). In Western Europe, growth was related to the shifting of resources out of agriculture and into industry and services. Trade policies designed to protect agriculture from low prices likely slowed this transition in countries such as Germany.
Was Korea’s economic success due to industrial policy? Irwin again argues “no”:
The experience of successful East Asian countries has given it a positive gloss, but even here standard history can mislead. In 1960, South Korea was saddled with an overvalued currency and exports of just 1 percent of GDP. The country’s ability to import depended almost entirely on US aid. After devaluing its currency in the early and mid-1960s, Korea’s exports became more competitive and exploded, reaching 20 percent of GDP by the early 1970s. The main policy involved setting a realistic exchange rate that allowed exports to flourish along with cheaper credit for all exporters, not targeted industries (Irwin 2021). Industrial policy did not really start until the Heavy and Chemical Industry Drive of 1973–79, which was later terminated because of its excessive costs and inefficiency. But Korea’s rapid growth had already been unleashed before the industrial policy era.
What about China’s efforts to create a domestic airplane industry? Agarwal writes:
However, the recent Chinese experience with the COMAC C919 aircraft shows that industrial policy is far from a silver bullet. Driven by the conviction that a great nation should have its own airliners, China has invested heavily in developing its commercial aircraft to challenge the dominance of Boeing and Airbus. Despite investing up to $70 billion in the Commercial Aircraft Corporation of China (COMAC), China’s state-owned manufacturer, the project has been delayed by more than five years as a result of regulatory, technological, and supply-chain hurdles. The delays were compounded by the special licensing requirements for technology parts exports to China imposed by the Trump administration in 2020. The C919 also hasn’t been certified yet by any major aviation authority outside China, partly due to safety issues. Thus, despite industrial policy success with its domestic high-speed rail network during the 2010s, China has not been able to replicate this achievement in the competitive global aviation industry.
Or China’s efforts to efforts to create a domestic shipbuilding industry? Irwin writes:
China illustrates how industrial subsidies can be an inefficient way of spending scarce resources. In 2006, China identified shipbuilding as a “strategic industry” and began massive production and investment subsidies, mainly through cheap loans. Evidence suggests that these policies did not produce large benefits but were wasteful (due to excess capacity) and distorted markets (forcing more efficient countries to adjust by reducing their output). China’s global market share grew at the expense of low-cost producers in Japan, South Korea, and Europe but without generating significant profits for domestic producers (Barwick, Panle Jia, Myrto Kalouptsidi, and Nahim Bin Zahur. 2019). The subsidies were dissipated through the entry and expansion of less efficient producers, which created excess capacity and led to increased industry fragmentation. The loans were political in the sense that state-owned enterprises rather than more efficient private producers received the bulk of the support. The shipbuilding industry did not generate significant spillovers to the rest of the economy, and there was no evidence of industry-wide learning by doing. … China did not get rich through industrial policy but by improving productivity in agriculture, allowing foreign investment in manufacturing, and unleashing the private sector.
The problems with industrial policy are well-known. If an idea seems like a money-maker, entrepreneurs and existing companies will invest their own money to make it happen. Thus, industrial policy only comes into play when politicians–who are not investing their own money–decide that some idea that they do not believe the private sector is supporting sufficiently is nevertheless certain to be a money-maker and a job creator. Sure, sometimes a blind squirrel finds the acorn. But choosing among the leftover ideas that private capital doesn’t see as worth funding is not likely to be, on average, a winning idea. Sure, at least some private firms and sources of finance will react to government subsidies, and accept the cash. In doing so, such firms will be focusing on how to attract political favoritism, which is not identical with deciding how best to produce high-quality products at lower costs. And explicitly favoring some industries or technologies or firms will implicitly disfavor others.
Nevertheless, here we go again. Agarwal notes the recent effort to create US industrial policy around semiconductors and clean energy, which follow on the efforts of the Trump administration to practice industrial policy in favor of steel and aluminum. Agarwal continues:
Meanwhile, Japan is providing subsidies worth more than $500 million to 57 companies to encourage them to invest domestically—as part of its efforts to reduce reliance on China. Similarly, the European Union is scaling up its industrial policy—including by setting aside €160 billion of its COVID-19 recovery fund for digital innovations such as chips, batteries, and climate adaptation. In response to massive subsidies in the US Inflation Reduction Act, Italy’s economy minister recently called for a common EU approach to support competitiveness and protect strategic production.
The real challenge with industrial policy is to be hard-headed and selective: that is, not choosing industries where it might be nice to be a global leader, but choosing those where the conditions of the time and place and technology have all come together in a way where a certain country at a certain time is ready to take the next step.
Consider solar energy panels as an example: in particular, China’s leading role in the global economy as a producer of low-cost solar panels. Yes, China has favored its solar industry. But the US was favoring photovoltaics back in the 1970s and 1980s. Japan went through a stage of favoring solar panels in the 1980s and 1990s, and so did Germany in the 21st century. In other words, China’s industrial policy success as a provider of solar panels was built on research and investments in other major economies over a period of decades, which didn’t work out very cost-effectively at the time for those other countries, combined with China’s skills in low-wage, low-cost manufacturing. Conversely, China’s failed industrial policy in shipbuilding, airplanes, semiconductors, and others are examples of where China chose industries where it might have been nice to be a leader, but disregarded the signs that, given existing technology and realities of China’s economy, China was not well-positioned to be a leader in those areas.
I’ll give Agarwal the last word here:
Former US Treasury Secretary Lawrence Summers recently said he liked his industrial policy advisers the same way he liked generals. “The best generals are the ones who hate war the most but are willing to fight when needed. What I worry is that people who do industrial policy love doing industrial policy.” In this context, the Trilemma reminds policymakers to take a cautious approach to industrial policy—while focusing on long-term growth, stability, and international cooperation. … Just like salt in cooking, a pinch of industrial policy can be helpful, but too much can overpower, and prolonged excess can harm.
For those want more, here are some posts from the last few years about industrial policy:
The authors point out that there have been two main waves of expanding public health insurance programs. The first wave, in the 1960s, included Medicare for the elderly and Medicaid for families with low incomes. These programs reduced the share of the US population without health insurance from about 25% in 1963 to 12% by the mid 1970s, but the share floated up to about 15% by the early 2000s. The second main wave was the passage of the Patient Protection and Affordable Care Act in 2010, which included both a large expansion of Medicaid and income-based subsidies for private insurance to be purchased through “exchanges.” The rate of uninsured fell from about 15% to about 10%.
What about the rest? The authors write:
Figure 3 breaks down the uninsured into shares eligible for various sources of insurance as of 2021. On the one hand, this figure points to some gaps in social safety net programs. Not all states have expanded Medicaid under the Patient Protection and Affordable Care Act of 2010, leaving about two million very low-income Americans in twelve states to fall into a “coverage gap” (not eligible for Medicaid, but too low income to be eligible for nongroup market subsidies). Further, undocumented immigrants are not eligible for subsidies or Medicaid under the 2010 law, affecting perhaps 4 million people (or 13 percent of the uninsured). But together, these two groups account for less than one-fourth of the remaining uninsured. About 63 percent of the uninsured (about 18 million people)—by far the largest share—are low- or middle-income Americans who qualify for subsidized insurance (via Medicaid or a health insurance exchange) that they have not taken up. Indeed, under the more generous subsidies available since 2021, about 40–50 percent of the uninsured likely qualify for fully-subsidized coverage; that is, coverage with zero out-of-pocket premium for them (Rae et al. 2021). Thus, a substantial share of the uninsured could be covered by inducing take-up of benefits that would be free to them. These facts indicate that affordability is not the only, or even the main, barrier to universal coverage; other forces are at work as well.
The authors discuss the problem of “frictions” in reaching this group:
Addressing the frictions associated with enrolling in and retaining health insurance may substantially increase coverage by inducing those who already qualify for health insurance coverage at no out-of-pocket cost or with heavy subsidies to take it up. This group comprises about 22 million of the 29 million uninsured, including about 7.3 million people who already qualify for free Medicaid, 11.0 million people who qualify for health insurance through a state-level insurance “exchange” (with about half that group qualifying for free coverage), and 3.5 million people who could be receiving health insurance through an employer. For example, recent work has highlighted how seemingly small administrative burdens involved with insurance enrollment can strongly affect coverage outcomes (Domurat, Menashe, and Yin 2021; McIntyre, Shepard, Wagner 2021; Shepard and Wagner 2022; Wright et al. 2017). This is especially true when individuals transition between different forms of coverage—for instance, between Medicaid and exchange eligibility, or after losing a job with employer coverage and qualifying for Medicaid. Policies that target transitioning individuals for outreach or auto-enrollment could have a significant impact on take-up, though there are implementation challenges (Dorn, Capretta, and Chen 2018).
Finally, the existing safety net system of emergency departments, federally qualified health centers, public clinics, and charity care could be bolstered. Eligibility along with the bundle of free services expected to be delivered could be expanded. For example, providers of such services could be reimbursed with public funds for primary care and medicines that prevent acute events, not just for emergency department visits.
For many people–including some people who in fact have health insurance– access to health care isn’t just about insurance. Financial issues are of course part of the picture. But access to health care is also about being able to navigate the system in other ways, like knowing who to contact, where to go, how to get an appointment, and what can be provided at that location.
The new artificial intelligence technologies are getting a lot of buzz. How are they likely to be used and how will they affect productivity. It seems to me obviously too early to know, but just the right time to start thinking concretely about plausible outcomes. In that spirit, Martin Neil Baily, Erik Brynjolfsson, and Anton Korinek discuss “Machines of mind: The case for an AI-powered productivity boom” (Brookings Institution, May 10, 2023).
The authors focus on what they call “foundation models,” which are “vast systems based on deep neural networks that have been trained on massive amounts of data and can then be adapted to perform a wide range of different tasks. ” Examples include “large language models” like ChatGPT (from Open AI), Bard (from Google), and Claude (from Anthropic). “But generative AI is not limited to text: in recent years, we have also seen generative AI systems that can create images, such as Midjourney, Stable Diffusion or DALL-E, and more recently multi-modal systems that combine text, images, video, audio and even robotic functions. “
Evidence is accumulating about how these technologies will affect actual jobs. The unifying theme here is saving time: that is, just as I save time when I can download articles while sitting at my desk, rather than walking through library stacks and making photocopies, lots of existing jobs can be done more quickly with the new technologies. Some examples:
There is an emerging literature that estimates the productivity effects of AI on specific occupations or tasks. Kalliamvakou (2022) finds that software engineers can code up to twice as fast using a tool called Codex, based on the previous version of the large language model GPT-3. That’s a transformative effect. Noy and Zhang (2023) find that many writing tasks can also be completed twice as fast and Korinek (2023) estimates, based on 25 use cases for language models, that economists can be 10-20% more productive using large language models.
But can these gains in specific tasks translate into significant gains in a real-world setting? The answer appears to be yes. Brynjolfsson, Li, and Raymond (2023) show that call center operators became 14% more productive when they used the technology, with the gains of over 30% for the least experienced workers. What’s more, customer sentiment was higher when interacting with operators using generative AI as an aid, and perhaps as a result, employee attrition was lower. The system appears to create value by capturing and conveying some of the tacit organizational knowledge about how to solve problems and please customers that previously was learned only via on-the-job experience.
We examine the productivity effects of a generative artificial intelligence technology—the assistive chatbot ChatGPT—in the context of mid-level professional writing tasks. In a preregistered online experiment, we assign occupation-specific, incentivized writing tasks to 444 college-educated professionals, and randomly expose half of them to ChatGPT. Our results show that ChatGPT substantially raises average productivity: time taken decreases by 0.8 SDs and output quality rises by 0.4 SDs. Inequality between workers decreases, as ChatGPT compresses the productivity distribution by benefiting low-ability workers more. ChatGPT mostly substitutes for worker effort rather than complementing worker skills, and restructures tasks towards idea-generation and editing and away from rough-drafting. Exposure to ChatGPT increases job satisfaction and self-efficacy and heightens both concern and excitement about automation technologies.
In this cross-sectional study of 195 randomly drawn patient questions from a social media forum, a team of licensed health care professionals compared physician’s and chatbot’s responses to patient’s questions asked publicly on a public social media forum. The chatbot responses were preferred over physician responses and rated significantly higher for both quality and empathy.
A milestone in computational biology was announced last July, when Alphabet Inc.’s DeepMind Technologies subsidiary announced that its AlphaFold2 AI system had been used to predict the three-dimensional structure of nearly all proteins known to science, essentially solving a problem that researchers had been trying to crack for the past 50 years. On March 16, Facebook-parent Meta Platforms Inc. said its research arm, Meta AI, had used its new AI-based computer program known as ESMFold to create a public atlas of 617 million predicted proteins. Like OpenAI’s ChatGTP, the Meta tool employs a large language model, which can predict text from a few letters or words.
We investigate the potential implications of large language models (LLMs), such as generative Pretrained Transformers (GPTs), on the U.S. labor market, focusing on the increased capabilities arising from LLM-powered software compared to LLMs on their own. Using a new rubric, we assess occupations based on their alignment with LLM capabilities, integrating both human expertise and GPT-4 classifications. Our findings reveal that around 80% of the U.S. workforce could have at least 10% of their work tasks affected by the introduction of LLMs, while approximately 19% of workers may see at least 50% of their tasks impacted. … The projected effects span all wage levels, with higher-income jobs potentially facing greater exposure to LLM capabilities and LLM-powered software. Significantly, these impacts are not restricted to industries with higher recent productivity growth. Our analysis suggests that, with access to an LLM, about 15% of all worker tasks in the US could be completed significantly faster at the same level of quality. When incorporating software and tooling built on top of LLMs, this share increases to between 47 and 56% of all tasks.
In a similar spirit, a much-cited report from two Goldman Sachs analysts, Joseph Briggs and Devesh Kodnani, considers ” The Potentially Large Effects of Artificial Intelligence on Economic Growth” (March 26, 2023, not directly at the Goldman Sachs site but available on the web if you hunt for it). They write:
We estimate that generative AI could raise annual US labor productivity growth by just under 1½pp over a 10-year period following widespread adoption, although the boost to labor productivity growth could be much smaller or larger depending on the difficulty level of tasks AI will be able to perform and how many jobs are ultimately automated. The boost to global labor productivity could also be economically significant, and we estimate that AI could eventually increase annual global GDP by 7%. Although the impact of AI will ultimately depend on its capability and adoption timeline, this estimate highlights the enormous economic potential of generative AI if it delivers on its promise.
Again, it seems to me too early to trust any specific estimates here. But several themes of this line of research seem especially salient to me.
First, these are practical discussions of how the new technologies can help workers in various jobs. Thus, they help us stop thinking about the new AU technologies as the embodiment of bad science fiction movies (and in fairness, a few good science fiction movies, too!), and instead to think about practical realities. These technologies are not about being taken over by sentient robots. They are about humans being able to do their work more quickly.
Second, many of these studies have an interesting theme that they tend to help the lesser-skilled worker in any occupation by more. The better-skilled workers often have already developed their own shortcut and information sources and methods, and are drawing on their greater mental database of past experiences. The AI tools often help other workers catch up.
But big picture, think about all the technological changes of the last two decades–heck, over the past two centuries. Surely, if technological advances and automation were likely to lead to mass unemployment, we would already have arrived at a world where only 10% or fewer of adults have jobs? But instead, needing many fewer workers for jobs like growing wheat, lighting streetlights, filling out accounting ledgers by hand, operating telephone switchboards, making a ton of steel, and so on and so on have opened the way for new occupations to arise. I see no compelling reason why this time and this technology should be different.
The Internal Revenue Service gets something north of 100 million individual tax returns each year. So how does the IRS decide how to deploy its 6,500 auditors? It counts on the computer programs to flag returns that seems more likely to be understating income. For example, a highly-paid two-earner couple might have income well into the mid-six-figures, but if what’s on the tax form matches what their employers and financial institutions reported, there’s not likely to be much gain in auditing them (at least not without some additional information). Nowhere on the tax form is the race of a taxpayer specified, and thus it is impossible for computer algorithm for who-gets-audited to take race into account in any explicit way. Nonetheless, it appears that the algorithm is auditing blacks substantially more than whites.
The method behind the study is interesting. Given that tax return and audit data doesn’t include race, on what basis can the researchers reach this conclusion? They infer race from data on names and where people live. The authors write:
Through a unique partnership with the Treasury Department, we investigate these questions using comprehensive microdata on approximately 148 million tax returns and 780,000 audits. … To address the problem of missing race, we use Bayesian Improved First Name and Surname Geocoding (BIFSG), imputing race based on full name and census block groups (Imai and Khanna, 2016; Voicu, 2018). We then propose and implement a novel approach for bounding the true audit disparity by race from the (imperfectly measured) BIFSG proxy. By individually matching a subset of the tax data to self-identified race data from other administrative sources, we provide evidence that the assumptions underlying our bounding approach are satisfied in practice.
When the researchers dig down into the data, they find that the difference in audits by race arises almost entirely in one category: audit rates for the working poor who are claiming the Earned Income Tax Credit. They write: “Black taxpayers claiming the EITC are between 2.9 and 4.4 times as likely to be audited as non-Black EITC claimants. … We find that the disparity cannot be fully explained by racial differences in income, family size, or household structure, and that the observed audit disparity remains large after conditioning on these characteristics. For example, among unmarried men with children, Black EITC claimants are audited at more than twice the rate of their non-Black counterparts.”
The EITC audits are almost all “correspondence audits,” which means that the taxpayer gets a letter from the IRS with some questions, and if you don’t write back with acceptable answers, your tax credit is denied.
Like many economists, I’m a fan of the Earned Income Tax Credit (as explained here). But I’ve also recognized that it has a long-standing problem: about one-fifth of the payments have often gone to those who did not qualify for them (as explained here). This problem arises from a combination of factors, ranging from complexity and uncertainty over whether households actually qualify to outright fraud (as discussed here). But again, it’s not obvious why these factors should affect blacks more than others.
The authors don’t have a definitive answer to this question, but they try to gain some insight by tinkering with the IRS algorithm that determines who gets audited, and then exploring how the mixture of audits would have shifted as a result. They show how “seemingly technocratic choices about algorithmic design” can lead to different results.
For example, it turns out that the IRS audit algorithm is calibrated (in part) to minimize the “no-change rate”–that is, the chance that an audit will not lead to any change in the amount of tax owed. This may seem reasonable enough, but consider two possible audits: one audit has a 95% chance of leading to a small change in taxes owed of less than $500. The other audit as a 10% chance of a large change in taxes owed of more than $10,000. Focusing on the larger payoffs will bring in more money. As the authors write: “[T]he taxpayers with the highest under-reported taxes tend to be non-Black, but the available data allow the classifi er model to assign the highest probabilities of underreporting to more Black than non-Black taxpayers.”
As another example, it seems that the algorithm emphasizes the possibility of “over-claiming of refundable tax credits rather than total under-reporting due to any error on the return.” One can imagine a possible political motive for this emphasis on over-claiming rathe rather than under-reporting, but it’s not a way to collect more revenue.
Finally, these “correspondence audits” of the working poor who receive the Earned Income Tax Credit are relatively easy to automate: the algorithm flags them and the letters go out. But when most of us think about audits, what we have in mind is a detailed look at the finances of high-income folks, perhaps especially those who own complex businesses or have complex financial arrangements. Given existing economic inequalities by race, such audits would focus less on blacks. And plausible estimates suggest that audits focused in this way could raise $100 billion per year, just through enforcement of existing tax laws. But it takes highly-skilled tax professionals to carry out such audits, and the IRS has a tough time holding on to people with the necessary skills and training.
Robert E. Lucas Jr. (Nobel 1995) has died. I will not try here to provide an overview of his work. For those who are interested in more detail, here are a few starting points.
In the late 1980s, Lucas began to focus more of his attention on issues of long-run growth. In what I think was his first prominent paper on the subject, he famously wrote (“On the Mechanics of Economic Development, Journal of Monetary Economics, 1988, pp. 3-42):
Is there some action a government of India could take that would lead the Indian economy to grow like Indonesia’s or Egypt’s? If so, what, exactly? If not, what is it about the’ nature of India’ that makes it so? The consequences for human welfare involved in questions like these are simply staggering: Once one starts to think about them, it is hard to think about anything else.
What I wanted to emphasize was that Lucas, among his other gifts, was a gifted writer and expositor. This gift wasn’t always readily apparent, because his research papers often intertwined verbal and algebraic exposition in a way that could be inaccessible to the uninitiated. Here are three examples that come immediately to mind.
Of the tendencies that are harmful to sound economics, the most seductive, and in my opinion the most poisonous, is to focus on questions of distribution. In this very minute, a child is being born to an American family and another child, equally valued by God, is being born to a family in India. The resources of all kinds that will be at the disposal of this new American will be on the order of 15 times the resources available to his Indian brother. This seems to us a terrible wrong, justifying direct corrective action, and perhaps some actions of this kind can and should be taken. But of the vast increase in the well-being of hundreds of millions of people that has occurred in the 200-year course of the industrial revolution to date, virtually none of it can be attributed to the direct redistribution of resources from rich to poor. The potential for improving the lives of poor people by finding different ways of distributing current production is nothing compared to the apparently limitless potential of increasing production.
Whether you agree with the sentiment or not (personally, I’m about 85% agreement on this one), it’s a strong piece of prose writing.
Here’s another example from his 2000 JEP essay on economic growth. This is Lucas describing a model in words–specifically, describing how he sees the pattern of economic growth across countries as a kind of horse race with rules of its own:
We begin, then, with an image of the world economy of 1800 as consisting of a number of very poor, stagnant economies, equal in population and in income. Now imagine all of these economies lined up in a row, each behind the kind of mechanical starting gate used at the race track. In the race to industrialize that I am about to describe, though, the gates do not open all at once, the way they do at the track. Instead, at any date t a few of the gates that have not yet opened are selected by some random device. When the bell rings, these gates open and some of the economies that had been stagnant are released and begin to grow. The rest must wait their chances at the next date, t + 1. In any year after 1800, then, the world economy consists of those countries that have not begun to grow, stagnating at the $600 income level, and those countries that began to grow at some date in the past and have been growing every since. …
The exact construction … is based on two assumptions. … The first is that the first economy to begin to industrialize—think of the United Kingdom, where the industrial revolution began—simply grew at the constant rate α from 1800 on. I chose the value α = .02 which … implies a per capita income for the United Kingdom of $33,000 (in 1985 U.S. dollars) by the year 2000. There is not much economics in the model, I agree, but we can go back to Solow (1956) and to the many subsequent contributions to the theory of growth for an understanding of the conditions under which per capita income in a country will grow at a constant rate. In any case, it is an empirically decent description of what actually happened.
So much for the leading economy. The second assumption is that an economy that begins to grow at any date after 1800 grows at a rate equal to α = .02, the growth rate of the leader, plus a term that is proportional to the percentage income gap between itself and the leader. The later a country starts to grow, the larger is this initial income gap, so a later start implies faster initial growth. But a country growing faster than the leader closes the income gap, which by my assumption reduces its growth rate toward .02. Thus, a late entrant to the industrial revolution will eventually have essentially the same income level as the leader, but will never surpass the leader’s level.
At least for me, this description of a racetrack, with the leader getting an early start and others having the ability to draw upon catch-up growth (because they can rely on skills and knowledge already invented) is a powerful way to describe an underlying algebraic model that illuminates overall patterns of long-run growth. The prose here isn’t flashy, but it is succinct and crystalline. Based on this model, Lucas wrote: “I think the restoration of inter-society income equality will be one of the major economic events of the century to come. Of course, this does not entail the undoing of the industrial revolution. In 1800 all societies were equally poor and stagnant. If by 2100 we are all equally rich and growing, this will not mean that we haven’t got anywhere!”
Finally, here’s an example from the short “banquet speech” that Lucas gave in accepting the Nobel prize, with a deathbed thought. Here’s the speech in full:
Your Majesties, Ladies and Gentlemen,
As you all know, Alfred Nobel did not choose to establish a prize in Economics. This prize was established in the 1960s, as a memorial, through the generosity of the Bank of Sweden. Generosity and, I would say, wisdom, as the establishment of a Nobel Prize in Economics has had a very beneficial effect on my profession, encouraging us to focus on basic questions and scientific method. It is as if by recognizing Economics as a science, the Bank of Sweden and the Nobel Foundation have helped us to become one, to come close to realizing our scientific potential. Now in 1995 this great honour is given to an economist who maintains that central banks should focus exclusively on the control of inflation, that they must be resolute in resisting the temptation to pursue other objectives, no matter how worthwhile these objectives may be. It would be understandable if people at the Bank of Sweden were now thinking: “Why don’t we tell this man to take his theories to the Bundesbank, and see how many kronor he can get for them over there?”
But this is no occasion for ill-feeling. It is not the time to criticize central bankers or anyone else. When Voltaire was dying, in his eighties, a priest in attendance called upon him to renounce the devil. Voltaire considered his advice, but decided not to follow it. “This is no time,” he said, “to be making new enemies”. In this same spirit, I offer my thanks and good wishes to the Bank of Sweden, to the Nobel Committee, and to everyone involved in this wonderful occasion.
When it comes to measuring how a minimum wage affects employment, the simple answers are wrong. For example, one simple approach is to can look at employment before and after a minimum wage increase, but if a recession occurs along the way, surely one would not want to attribute the resulting job changes that to minimum wage increases. Also, it’s understandably easier for politicians to pass minimum wage increases when the economy is growing, but you wouldn’t want to mix up an overall climate of economic growth with the effects of a minimum wage increase, either.
Ideally, you would come up with several other and more plausible methods for isolating the effects of a minimum wage increase, so that you could compare results across these methods. What I want to do here is to describe first how such a study might be done, but not reveal the results here at the start. After all, you aren’t the sort of person who would judge the methods of a study by whether the results confirmed your previous biases, are you? No, I’m sure you’re not. Instead, you’re the kind of person who thinks first whether the method of the study makes sense, and then to the extent that it does, you will put a corresponding degree of belief on the results.
The city of Minneapolis voted in 2017 to phase in an increase in the city-wide minimum wage, starting in 2018. It would read $15/hour for large firms (employment of 100 or more) by July 2022 and $15/hour for small firms by July 2024. The city also commissioned a series of studies on the effects of this change, to be overseen by the Federal Reserve Bank of Minneapolis. The most recent of these reports is “Economic Impact Evaluation of the City of Minneapolis’s Minimum Wage Ordinance,” with Loukas Karabarbounis, Jeremy Lise, and Anusha Nath as the primary investigagors (Federal Reserve Bank of Minneapolis, May 1, 2023).
The researchers have access to non-public data from the state government agency runs the unemployment insurance program, because when employers pay their unemployment insurance premiums, they need to file forms each quarter saying giving total compensation and total hours worked for each employee–which means you can easily calculate the average wage per hour. The researchers merge this with data from the Quarterly Census of Employment and Wages, carried out by the US Bureau of Labor Statistics. This data includes the industry, the location by city and zip code, and if a given business establishment at a certain location is part of a firm that has establishments at other locations, too.
The authors of the Minneapolis Fed study apply two main methods for thinking about the question of the effects of a minimum wage that is being phased higher over time. I’ll try to offer a quick-and-dirty intuitive summary here.
First, they use what are called “synthetic control methods,” which look at changes over time. Specifically, they look at 36 US cities similar in size to Minneapolis, but which were not seeing a rise in their minimum wage during this time. They average together data from these cities, putting different weights on different cities, so that the weighted average of these other cities tracks the data from Minneapolis pretty well in the years leading up to 2017. The hypothesis behind this approach is that jobs and wages in the other cities tracked Minneapolis pretty well up to the passage of the minimum wage, it should have kept doing so–unless something changed.
As another example of this synthetic control method, they take the same approach but instead look only at cities inside Minnesota. Again, they weight the data from these cities so that in the lead-up to the higher minimum wage, it tracks the Minneapolis data. Again, the hypothesis is that a divergence after 2018 or so can be attributed to the higher minimum wage.
This synthetic control approach has been used in other studies, but I think it’s fair to say that it has less plausibility for this study in recent years. Compared to other cities around the country, as well as cities within Minnesota, Minneapolis experiences rioting after the murder of George Floyd in May 2020. In addition, the pandemic recession may well have affected different cities in different ways: in particular, the effects in bigger cities like Minneapolis might be different from the effects in smaller cities.
But I know you’re not the kind of person who would be happy with the results of any single methodology, right? You are the kind of person who wants several different methods, so that you can compare between them.
A second approach uses “cross section” methods which do comparisons across firms and workers. In one cross-section approach, the authors look at “establishment effects” within the city of Minneapolis. Remember, they have data on industry, location, average wages, and hours worked for firms in Minneapolis. They write:
Consider a full-service restaurant, Restaurant A. It is located on the fictitious Plain Street and pays all of its workers at least 16 dollars per hour in 2017. This restaurant is not directly exposed to the increase in minimum wage, because all its workers are already earning a wage above 15 dollars. Next, consider another full-service restaurant on Plain Street, Restaurant B, which pays all its workers in 2017 an hourly wage of 7.5 dollars. Restaurant B is highly exposed to the minimum wage increase, because to continue to operate using the same workforce, it needs to increase wages for all workers.
Thus, they can compare establishments in the same industry and the same neighborhood, some of which are more affected by the higher minimum wage than others. You can compare whether the establishments that are more affected by the minimum wage adjust hours or employment by larger amounts.
However, An obvious concern here is that perhaps some firms that were previously paying low wages go under, but their workers are absorbed by firms in the same industry and neighborhood paying higher wages. Or if workers found jobs just outside the Minneapolis city boundaries, it might look as if jobs were lost, when the jobs actually just moved a few miles. Such effects needs to be taken into account.
Thus, a different cross-section approach looks at comparisons across workers. Consider workers in Minneapolis, some working for establishments that previously paid lower wages, and some that did not. The researchers can then track what happens to those workers. They can also take into account effects of being in a certain industry: say, restaurants took a bigger hit during the pandemic. Thus, the researchers can see what happened to the workers who seemed most likely to be affected by a higher minimum wage.
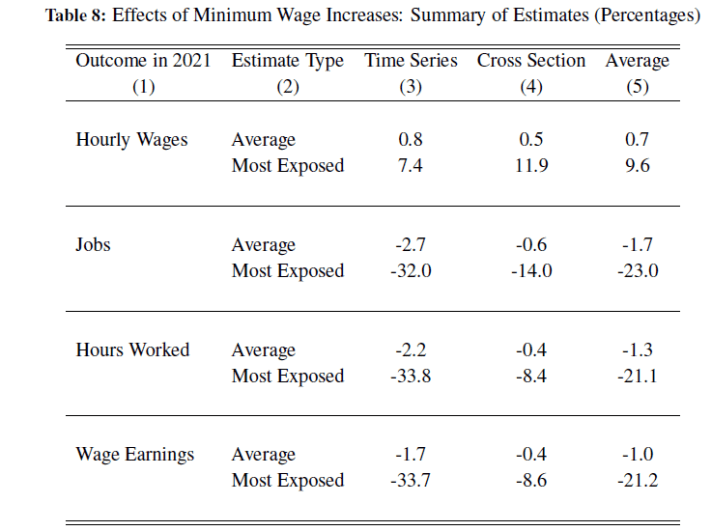
One final step before describing the results. Some industries have a lot of low-wage workers, so one would expect these industries to be more exposed to the effects of a higher minimum wage. Thus, the researchers do these comparisons in two ways: looking at the effects across all jobs, and looking at the effect just in the most exposed industries. In Minneapolis, the six industries where more than 30% of the workers had been making less than the new minum wage were: ” retail trade (44); administration and support (56); health care and social assistance (62); arts, entertainment, and recreation (71); accommodation and food services (72); and other services (81), which consists of repair and maintenance shops, personal and laundry services, and various civic, professional, and religious organizations.”
The first column shows four categories of outcomes. The second column shows an average effect for all jobs, and also just for the industries whose share of lower-wage workers made them “most exposed” to an increase. The third column, “Time Series,” is average results from the two synthetic control method. The fourth column, “Cross Section,” is results from the comparisons across establishments and across workers with different exposures to a higher minimum wage. The final column averages results from the two previous columns.
The overall results are similar to those from a number of other studies. As one might expect, the effects are much smaller for the average of all jobs than for the most exposed industries. A minimum wage tends to raise wages (for those who still have jobs), but leads to a decline in job and a decline in hours worked. For the average job, the higher wages and lower hours worked pretty much balance each other out, so total earnings don’t change much. For the jobs most-exposed to a minimum wage increase, the drop in hours exceeds the rise in wages, so total wage earnings decline.
My bottom line here is not to cheerlead for or against higher minimum wages. I’m trying to make the point that serious studies using a variety of methods show genuine tradeoffs–especially for industries that tend to pay lower wages and for those working in such industries. A serious discussion of minimum wages won’t ignore such tradeoffs or try to sweep them aside with assertions of how things “should” be. Specifically, a substantially higher minimum wage in a city will discourage some industries more than others, and in this way affect the mix of goods and services available nearby to residents of the city, and will have heavier effects on the hours and jobs of workers in those industries, too.