The \”economy\” measures what is bought and sold. Thus, it is standard in introductory economics classes to point out that if my neighbor and I both mow our own lawns, it\’s not part of GDP. But if we hire each other to mow each other\’s lawns, GDP is then higher–even though exactly the same amount of lawn-mowing output was produced. In a broader sense, what\’s would be the economic value of nonmarket family services if they were valued instead in monetary terms?
The McKinsey Global Institute provides some background on this issue in the September 2015 report: The Power of Parity: How Advancing Women\’s Equality Can Add $12 Trillion to Global Growth.\” The report offers some calculations that if women participated in the paid labor force at the same level as the leading country in their region (thus, not holding those in Latin America, Africa, or the Middle East to the standard of northern Europeans), it would add $12 trillion to GDP. However, the report also notes that these women who are not in the paid labor force are of course already working and producing at least $10 trillion in nonmarket output.
Beyond engaging in labor markets in ways that add to GDP, a large part of women’s
labor goes into unpaid work that is not accounted for as GDP. Women do an average
of 75 percent of the world’s total unpaid care work, including the vital tasks that keep
households functioning, such as child care, caring for the elderly, cooking, and cleaning.
In some regions, such as South Asia (including India) and MENA, women are estimated to undertake as much as 80 to 90 percent of unpaid care work. Even in Western Europe and North America, their share is high at 60 to 70 percent. Time spent in unpaid care work has a strong negative correlation with labor-force participation rates, and the unequal sharing of household responsibilities is a significant barrier to enhancing the role of women in the world economy. Applying conservative estimates based on available data on minimum wages, the unpaid care work of women could be valued at $10 trillion of output per year—an amount that is roughly equivalent to 13 percent of global GDP. In the United States alone, the value of unpaid care work carried out by women is about $1.5 trillion a year. … Data from 27 countries indicate that some 61 percent of unpaid care work (based on a simple average across countries) is routine household work, 14 percent involves taking care of household members, 11 percent is time spent on household purchases, and 10 percent is time spent on travel …
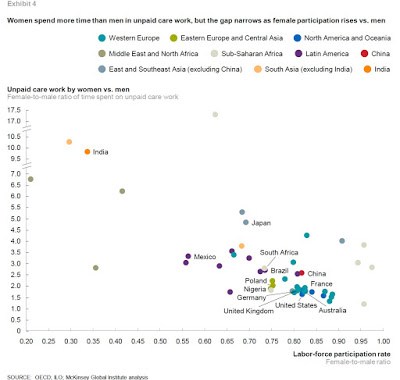
The amount of unpaid work that women do is closely related to female participation in the paid labor force. The horizontal axis shows the ratio of the labor force participation rate of women to that of men. The vertical axis shows the ratio of time spent on unpaid care by women to the time spent by men. Thus, in India, women spend about 10 times as many hours on unpaid care as men, and their labor force participation rate is one-third as high. In a number of high-income countries, women spend 1.5-2 times as many hours on unpaid work as men, and the labor force participation rate for women is about 80% of the level for men. (For the record, \”unpaid care\” is defined not just as care for other family members, but also includes housework and voluntary community work.) The MGI report notes: \”Globally, women spend three times as many hours in unpaid domestic and care work as men.\”
Some additional background on unpaid work by women is available in \”Unpaid Care Work:
The missing link in the analysis of gender gaps in labour outcomes,\” written by Gaëlle Ferrant, Luca Maria Pesando and Keiko Nowacka for the OECD Development Centre in December 2014.
The two figures shows ratios of time spent on unpaid care by women relative to men: the left-hand figure is across regions; the right-hand figure is across countries divided by income level. The left-hand figure shows that the female-to-male ratio of time spent on unpaid care is nearly 7 in the Middle East and North Africa region and in the South Asia region, but is below 2 in Europe and North America. The right-hand figure shows that the ratio is roughly three in low-income, lower-middle income, and upper-middle income countries, but less than 2 in high-income countries.
The level of unpaid care matters for several reasons. The most obvious, perhaps, is the McKinsey calculation that women moving into the paid labor force could raise world GDP by $12 trillion. But there are a number of more subtle ways in which the inclusion of unpaid work alters one\’s sense of social output. Ferrant, Pesando and Nowacka point out (citations omitted):
\”It leads to misestimating households’ material well-being and societies’ wealth. If included, unpaid care work would constitute 40% of Swiss GDP and would be equivalent to 63% of Indian GDP. It distorts international comparisons of well-being based on GDP per capita because the underestimation of material well-being would be proportionally higher in those countries where the share of housewives and home-made consumption is higher. For instance, by including Household Satellite Accounts the GDP per capita of Italy reaches from 56% to 79% of the USA’s GDP, and 98% to 120% of that of Spain.\”
In a broader sense, of course, the issue is not to chase GDP, but to focus on the extent to which people around the world are having the opportunity to fulfill their capabilities and to make choices about their lives. Countries where women have more autonomy also tend to be countries where the female-to-male ratios of time spent on unpaid care are not as high. The share of unpaid care provided by women highly correlated with women\’s ability to participate in the paid workforce, as well as to acquire skills and experience that lead to better-paying jobs, as well as participating in other activities like political leadership. Ferrant, Pesando and Nowacka write:
\”The unequal distribution of caring responsibilities between women and men within the household thus also translates into unequal opportunities in terms of time to participate equally in paid activities. Gender inequality in unpaid care work is the missing link in the analysis of related to gender gaps in labour outcomes in three areas: gender gaps in labour force participation rates, quality of employment, and wages.\”
In a similar vein, the MGI report notes: \”Beyond GDP, there could be other positive effects. For instance, more women could be financially independent, and there may be intergenerational benefits for the children of earning mothers. In one study of 24 countries, daughters of working mothers were more likely to be employed, have higher earnings, and hold supervisory roles.\”
What are the pathways by which the time spent on unpaid care activities might be reduced? Many women are familiar with the feeling that a large part of their take-home pay is going to childcare, a housecleaner, lawn care, takeout food when there was no time to cook, and the like. Having people pay each other for what was previously unpaid work will add to GDP, but it may not add to total output broadly understood.
Thus, the challenge is reduce unpaid work in ways that don\’t just swap unpaid work around, but actually free up time and energy. Both the McKinsey report and the OECD authors have similar comments about how this has happened in practice. Historically, one major change for high-income countries has been the arrival of labor-saving inventions. The MGI report notes:
Some of the routine household work and travel time can be eliminated through better public services and greater automation. For example, in developing countries, the time spent on household chores is increased by poor public infrastructure. Providing access to clean water in homes can reduce the time it takes to collect water, while electricity or solar power can eliminate the time spent hunting for firewood. Tools such as washing machines and kitchen appliances long ago lightened much of the drudgery associated with household work in higher-income countries, and millions of newly prosperous households in emerging economies are now adopting them, too. Innovations such as home-cleaning robots may one day make a leap forward in automating or streamlining many more tasks.
A number of other issues that affect the balance between unpaid and paid labor: the prevalence of workplace policies like family leave and flex-time; the availability of high-quality child care and elder care; the length of school days along with preschool and post-school programs; and the extent to which money that women earn in the paid workforce is reduced by government tax, or by the withdrawal of transfers that would otherwise have been available. And of course, social attitudes about the role of women are central to these outcomes.
The MGI report gives a sense of how these forces have evolved in the US economy in recent decades:
In the United States, for example, labor-force participation by women of prime
working age rose from 44 percent in 1965 to 74 percent in 2010. Over this period, the time women spent on housework was cut almost in half, but the hours they spent on child care actually rose by 30 percent, reflecting evolving personal and familial choices. Both housework and child care became more equitably shared. Men’s share of housework rose from 14 percent in 1965 to 38 percent in 2010, and their share of child care from 20 percent to 34 percent.
The ultimate constraint which rules us all is that a seven-day week has 168 hours. A gradual reduction in the time spent on unpaid care activities, which have traditionally been primarily the job of women, is part of what makes society better-off.


